Hot Water, Explained
Practical guides on geyser costs, compliance, safety, and solar-first hot water — written for homeowners, installers, developers, and insurers.
All Blog
Hot Water Costs & Savings
Solar-PV Hot Water Explained
Installation & Compatibility
Maintenance, Reliability & Warranty

2026 update: Municipal water & electricity tariff increases vs inflation since 1996
In 2021, PowerOptimal published an analysis of municipal water and electricity tariff increases compared to inflation since 1996. That study revealed a stark reality: the average price of both water and electricity across South Africa's four largest municipalities had increased roughly four times faster than inflation.
Hot Water Costs & Savings
Apr 1, 2026

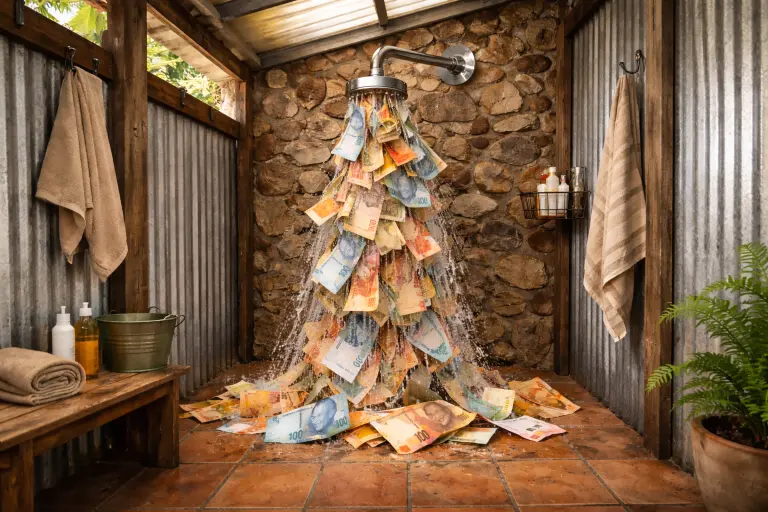
2026 Update: What does a shower cost in South Africa?
A 10-minute shower in South Africa now costs R26.67. For a family of four, that's nearly R39,000 a year — just on showers. Here's the full 2026 breakdown, what's driving it, and what you can actually do about it.
Hot Water Costs & Savings
Mar 11, 2026

Solar PV vs Solar Thermal vs Heat Pumps for Water Heating: Which Is Best in 2026?
Water heating is the single biggest energy consumer in South African households, accounting for 40% of total household energy use (ref). That makes it an obvious target for cutting your electricity bill.
Maintenance, Reliability & Warrantys
Jan 18, 2026

2026 Update: Eskom tariff increases vs inflation since 1988 (with projections to 2028)
Eskom tariffs increased by an eye-watering 18.7% in 2023 and again by a painful 12.7% in 2024. This compares to CPI (Consumer Price Index) increases of 5.9% and 4.9% over the same two-year period.
Hot Water Costs & Savings
Aug 10, 2024
What does a shower cost in South Africa? 2025 Update
With the rapid increases in the price of electricity and water over the past decade, the question is: what does a shower or bath cost in South Africa in 2024? Most South Africans know electricity prices have skyrocketed — a 937% increase between 2007 and 2024. But water prices have been climbing even faster over the same period.
Hot Water Costs & Savings
Aug 10, 2024

Municipal water & electricity tariff increases vs inflation since 1996: 2024 Update
We first published this analysis in 2021. With updated data through 2024, the trend has not improved: residential water and electricity tariffs have continued to outpace inflation by a wide margin.
Hot Water Costs & Savings
Jan 18, 2026
All Blog
Hot Water Costs & Savings
Solar-PV Hot Water Explained
Installation & Compatibility
Maintenance, Reliability & Warranty
2026 update: Municipal water & electricity tariff increases vs inflation since 1996
In 2021, PowerOptimal published an analysis of municipal water and electricity tariff increases compared to inflation since 1996. That study revealed a stark reality: the average price of both water and electricity across South Africa's four largest municipalities had increased roughly four times faster than inflation.
Hot Water Costs & Savings
Apr 1, 2026
2026 Update: What does a shower cost in South Africa?
A 10-minute shower in South Africa now costs R26.67. For a family of four, that's nearly R39,000 a year — just on showers. Here's the full 2026 breakdown, what's driving it, and what you can actually do about it.
Hot Water Costs & Savings
Mar 11, 2026
Solar PV vs Solar Thermal vs Heat Pumps for Water Heating: Which Is Best in 2026?
Water heating is the single biggest energy consumer in South African households, accounting for 40% of total household energy use (ref). That makes it an obvious target for cutting your electricity bill.
Maintenance, Reliability & Warrantys
Jan 18, 2026
2026 Update: Eskom tariff increases vs inflation since 1988 (with projections to 2028)
Eskom tariffs increased by an eye-watering 18.7% in 2023 and again by a painful 12.7% in 2024. This compares to CPI (Consumer Price Index) increases of 5.9% and 4.9% over the same two-year period.
Hot Water Costs & Savings
Aug 10, 2024
What does a shower cost in South Africa? 2025 Update
With the rapid increases in the price of electricity and water over the past decade, the question is: what does a shower or bath cost in South Africa in 2024? Most South Africans know electricity prices have skyrocketed — a 937% increase between 2007 and 2024. But water prices have been climbing even faster over the same period.
Hot Water Costs & Savings
Aug 10, 2024
Municipal water & electricity tariff increases vs inflation since 1996: 2024 Update
We first published this analysis in 2021. With updated data through 2024, the trend has not improved: residential water and electricity tariffs have continued to outpace inflation by a wide margin.
Hot Water Costs & Savings
Jan 18, 2026
